Trabla: Chrome: global js function "debugger" - debugger breakpoint from code
debugger - is global js function, equivalent of setting "manual" breakpoint in "Sources" chrome tab ( DevTools ).
It causes Chrome to stop program execution and start a debugging session at the line where it was called.
The debugger command is not a method of the console object.
Solving:
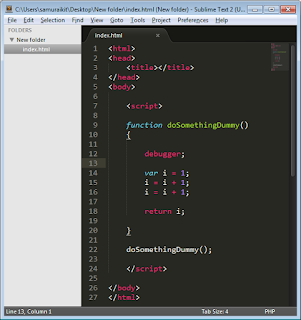
1. Create example simple index.html page
<html>
<head>
<title></title>
</head>
<body>
<script>
function doSomethingDummy()
{
debugger;
var i = 1;
i = i + 1;
i = i + 1;
return i;
}
doSomethingDummy();
</script>
</body>
</html>
2. Open page in chrome
3. Press Ctrl + Shift + I or right click - select "Inspect"
Official Docs: https://developer.chrome.com/devtools/docs/console-api#debugger


No comments:
Post a Comment